Stay informed with free updates
Simply sign up to the Visual and data journalism myFT Digest — delivered directly to your inbox.
This article is first published in the FT Climate Graphic: Explained newsletter. Sign up here to receive it in your inbox each Sunday.
Heat domes have brought dangerously high temperatures this summer to parts of Europe and the US.
Southern Europe continued to endure extreme heat through to the end of July, as countries including Cyprus, Turkey and Greece experienced temperatures above 40C.
These periods of intense heat that are increasing in strength and duration have an adverse effect on one of our most precious resources — water.
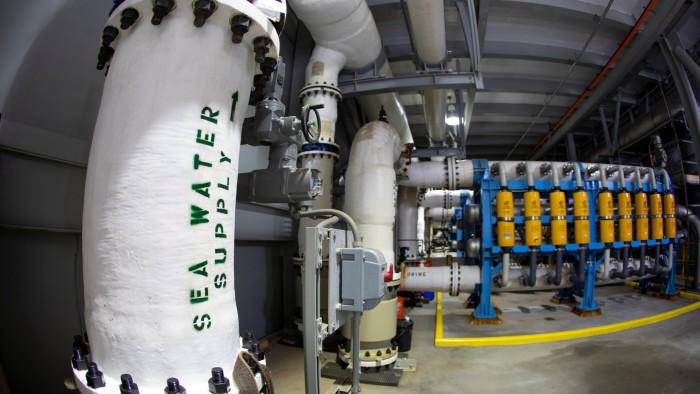
As climate change makes rains more erratic and groundwater sources run low, governments across the world are seeking solutions to keep the taps running. Some are turning to desalination, an industry that is expected to exceed $20bn in 2027. But the technology comes with some unpalatable side-effects.
We looked at water stress across the globe and the desalination process, where salt is removed from seawater either through reverse osmosis or thermal distillation to produce fresh water. (We covered the more technical aspects of the desalination process in a newsletter last year — if you missed this issue then email us at [email protected] and we’ll send it to you).

How we made it
The Aqueduct water risk atlas is a global index of 13 indicators including water stress. It measures the ratio of total water demand (encompassing domestic, industrial, irrigation and livestock uses) to available renewable surface and groundwater supplies.
The higher the value, the more competition there is for water.
The downloadable dataset is huge! We used R, a programming language for statistical analysis, to filter only the water stress data and export the CSV (comma separated values) file, which we then could pull into Qgis, our mapping tool of choice.
[Nerd note: Here we join the Aqueduct data with the polygons for hydrological basins (downloaded from Hydrosheds) using a common ID provided in both datasets, and then colour coded the map according to Aqueduct’s water stress categories (low, low-to-medium, etc). We then simplified the map to reduce the number of polygons, as Qgis allows you to group together polygons of the same category, so we had something like the image below, before styling it in Adobe.]

Our second map shows the extent of reverse osmosis water treatment plants across Europe, north Africa and the Gulf by cubic metres of water produced daily.
The Gulf’s well-established desalination industry is still dependent on the old thermal technology, however the map shows it does have a considerable number of reverse osmosis plants producing 900,000 cubic metres of water a day.
To map the desalination plants we wanted, we used data shared by Global Water Intelligence. The full dataset included around 3,000 live sites — far too many to legibly display — so we focused on reverse osmosis facilities with a capacity of more than 1,000 cubic metres per day.
We again imported the data into Qgis, and changed the point size by daily water capacity using the Flannery scale method, which makes the difference in circle size easier to perceive.
In both maps, we used the Robinson projection to give the world a bit of curvature while keeping the country sizes in proportion. This also meant the Mediterranean region did not require the entire width on our second map and we could display it on the same view as the Gulf.

Many desalination plants are naturally enough packed closely along coastlines, so to we reduced points’ opacity and applied a blend mode in Adobe Illustrator which improved visibility and helps to see the full extent of where reverse osmosis is happening.
An estimated one in 10 people now lives in a country with what the UN’s water agency classifies as “high and critical water stress”.
Register for free for FT Sessions @ New York Climate Week, to coincide with New York Climate Week 2025, the programme will consist of discussions on themes covered during this mainstay event for sustainability leaders.
Climate Capital

Where climate change meets business, markets and politics. Explore the FT’s coverage here.
Are you curious about the FT’s environmental sustainability commitments? Find out more about our science-based targets here